背景
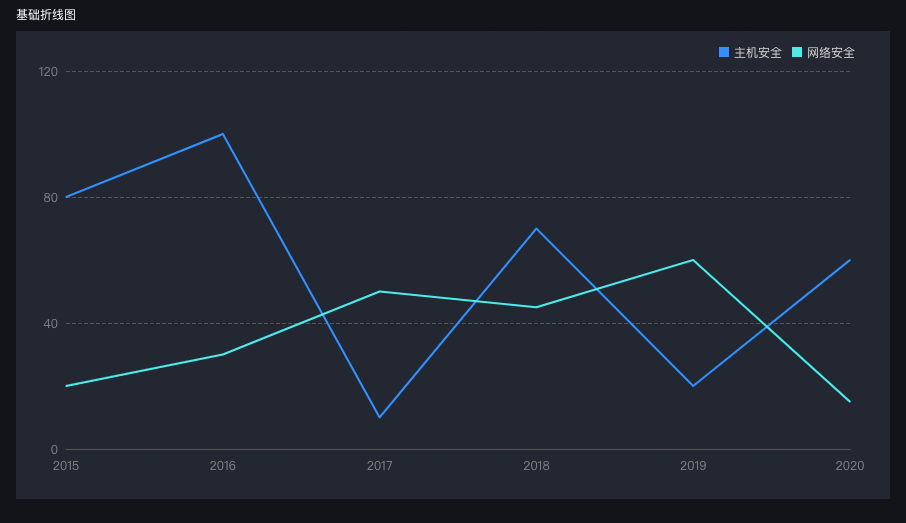
针对在如何在图表编辑器场景下快速索引图元所对应的方案,我们得到了ECharts图元拾取方案。但图表场景通常具有很多【线条】类型的图元,这些图元宽度普遍不高,通常为【1-2】个像素宽度。这就给通过交互的方式来拾取图元造成了一定的困扰,不容易选取、很容易移出热区。本文探究一种图表元素拾取扩大热区范围方案。

核心思路
核心思路其实很简单一句话概括的话就是:通过后期在图元上插入一个透明的图层,并绑定与图元相同的事件,来达到扩大图元拾取热曲的效果。
具体方案
SVG后处理-插入透明图层
具体方案并不复杂,大致步骤为:
- 遍历图表的SVG元素,识别其中
path元素
- 克隆
path节点
- 修改克隆节点的【线宽】、【透明度】等属性
- 将克隆节点插入原节点上方
其中关于svgVisitor相关可以参阅:SVG后处理
1
2
3
4
5
6
7
8
9
10
11
12
13
14
15
16
17
18
19
20
21
22
23
24
25
26
27
28
29
30
31
32
33
34
35
36
37
38
39
40
41
42
43
44
45
46
47
48
49
50
51
|
export const createShadowSvg = function (chartContextDom) {
const chartSVGs = chartContextDom.querySelectorAll("svg");
for (let i = 0; i < chartSVGs.length; i++) {
svgVisitor(chartSVGs[i], {
pathVisitor: function (pathDom) {
const elTargets = pathDom.getAttribute("elTarget");
const strokeWidth = pathDom.getAttribute("stroke-width");
if (!elTargets) return;
if (strokeWidth && parseInt(strokeWidth) >= DEFAULT_SHADOW_STROKE_WIDTH)
return;
if (parseInt(strokeWidth) === 0) return;
const elTargetObject = JSON.parse(elTargets);
if (elTargetObject.element === "symbol") return;
const cloneNode = pathDom.cloneNode();
cloneNode.setAttribute("isShadow", true);
cloneNode.setAttribute("stroke", "transparent");
cloneNode.setAttribute("fill-opacity", "0");
if (elTargetObject.component === "series") {
cloneNode.setAttribute("stroke-width", SERIES_SHADOW_STROKE_WIDTH);
} else {
cloneNode.setAttribute("stroke-width", DEFAULT_SHADOW_STROKE_WIDTH);
}
cloneNode.setAttribute("style", "cursor: pointer");
const dasharray = cloneNode.getAttribute("stroke-dasharray");
if (dasharray) {
cloneNode.removeAttribute("stroke-dasharray");
}
pathDom.parentNode.insertBefore(cloneNode, pathDom);
},
});
}
};
|
参考 & 引用
ECharts图元拾取方案 | SZ 博客 (sz-p.cn)
SVG后处理 | SZ 博客 (sz-p.cn)
