背景
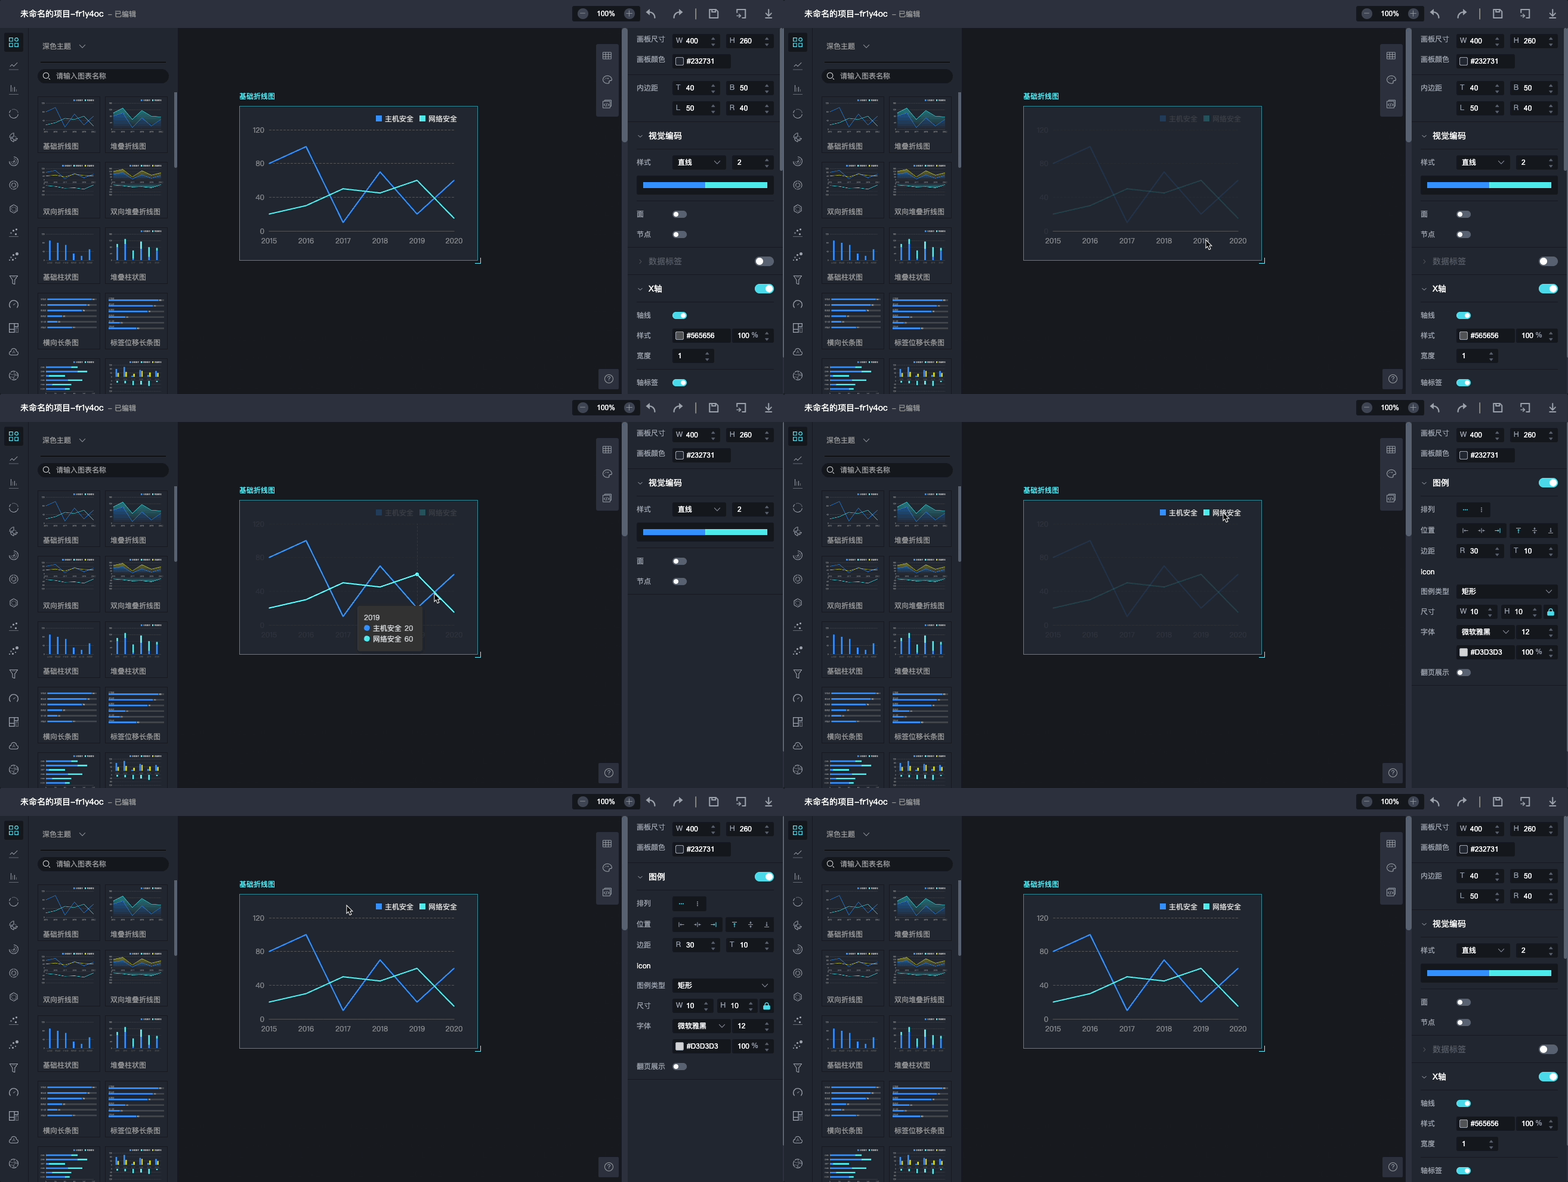
针对在如何在图表编辑器场景下快速索引图元所对应的方案,我们得到了ECharts图元拾取方案。本文介绍两种方案去提示用户当前拾取到的图元。

提示框方案
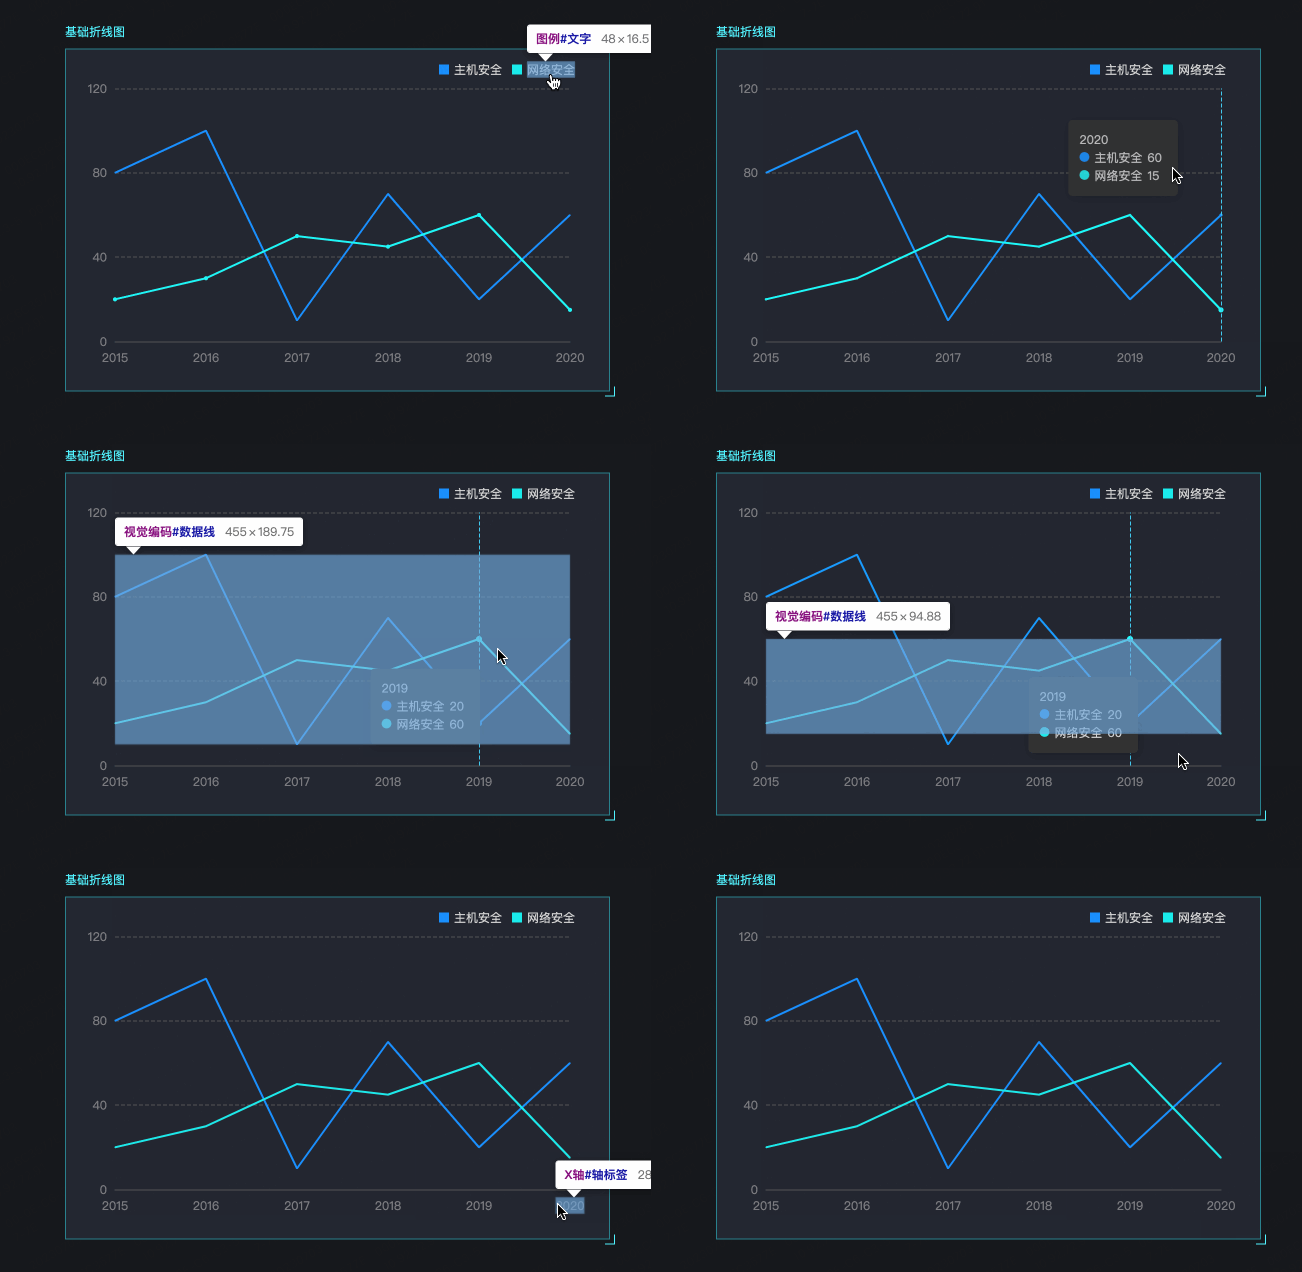
以研发的视角看,提示Dom信息自然的会联想到Chrome的Devtool的方案。该方案参照Chrome的Devtool的提示样式,提示了元素的名称、元素类型、图元大小等信息。

优势与弊端
优势:展示的信息更加丰富。
弊端:提示方式过于生硬,非研发用户接受度不高。
具体实现
1
2
3
4
5
6
7
8
9
10
11
12
13
14
15
16
17
18
19
20
21
22
23
24
25
26
27
28
29
30
31
32
33
34
35
36
37
38
39
40
41
42
43
44
|
this.domVisualSelector = new DomVisualSelector({
filter: function (e) {
const elTarget = e.target.getAttribute("elTarget");
if (elTarget) {
return true;
}
return false;
},
onSelect: (e) => {
const elTarget = e.target.getAttribute("elTarget");
if (!elTarget) {
return
}
const editorInfo = JSON.parse(elTarget)
const { component, element } = editorInfo
const { chartName, chartType } = this.getSelectedChartInfo()
this.selectChartDom(chartName, chartType, component, element)
e.stopPropagation();
},
tooltipOption: {
formatter: (targetElementInfo) => {
delete targetElementInfo.elementInfo.style;
const elTarget = targetElementInfo.targetEl.getAttribute("elTarget");
const { chartName, chartType } = this.getSelectedChartInfo()
const editorInfo = JSON.parse(elTarget)
const { component, element } = translateDevInfoToHumanReadable({ chartName, chartType }, editorInfo);
targetElementInfo.elementInfo.tagName = component;
targetElementInfo.elementInfo.idValue = element;
}
}
})
|
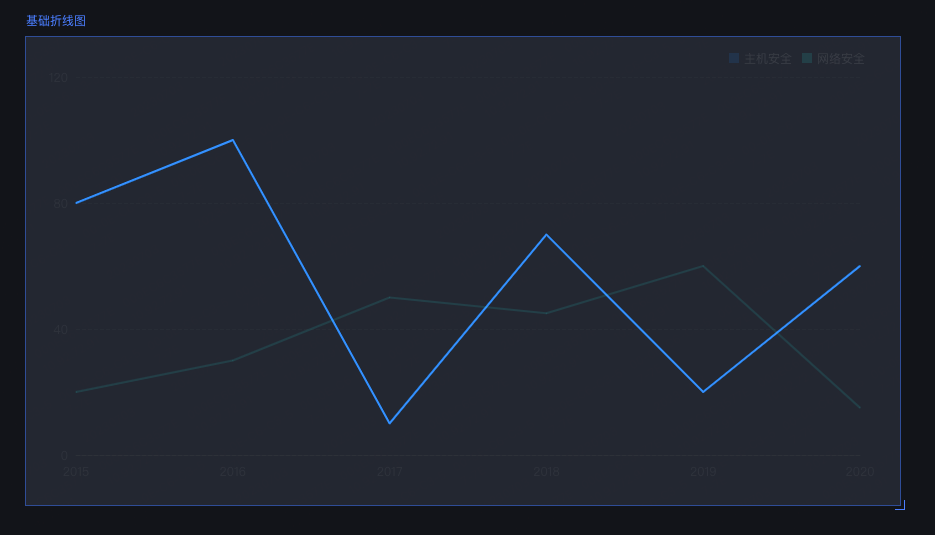
淡入淡出方案

优势与弊端
优势:提示效果更加友好,所见即所得。
弊端:提示信息过少,且提示过程的淡入淡出效果侵入了图表原有的默认交互效果。
具体实现
1
2
3
4
5
6
7
8
9
10
11
12
13
14
15
16
17
18
19
20
21
22
23
24
25
26
27
28
29
30
31
32
33
34
35
36
37
38
39
40
41
42
43
44
45
46
47
48
49
50
51
52
53
54
55
56
57
58
59
60
61
62
63
64
65
66
67
68
69
70
71
72
73
74
75
76
77
78
79
80
81
82
83
84
85
86
87
88
89
90
91
92
93
94
95
96
97
98
99
100
101
102
103
104
105
106
107
108
109
110
111
112
113
114
115
116
117
118
119
120
121
122
123
|
onChartMounted: (el: HTMLElement) => {
el.onmousemove = getOnMouseMoveInChartFunction(el);
el.onmouseleave = getOnMouseLeaveInChartFunction(el);
}
export const getOnMouseMoveInChartFunction = function (el) {
let preSelectedDomTargetInfo = undefined;
return function (e) {
const selectedDom = e.target;
const chartInfo = JSON.parse(el.getAttribute("elTarget") || '{}');
let selectedDomTargetInfo = selectedDom.getAttribute("elTarget");
const selectedDomTargetInfoObj = {
tagName: selectedDom.tagName,
chartTag: chartInfo.chartTag,
chartType: chartInfo.chartType,
chartOption: chartInfo.chartOption,
...JSON.parse(selectedDomTargetInfo),
};
if (isUnNeedPickDom(selectedDomTargetInfoObj)) {
selectedDomTargetInfo = null;
selectedDom.style.pointerEvents = "none";
}
if (selectedDomTargetInfo !== preSelectedDomTargetInfo) {
preSelectedDomTargetInfo = selectedDomTargetInfo;
if (selectedDomTargetInfo) {
blurUnselectedElementCategory(
el,
selectedDomTargetInfoObj
);
} else {
unBlurUnselectedElementCategory(el);
}
}
};
};
export const getOnMouseLeaveInChartFunction = function (el) {
return function () {
unBlurUnselectedElementCategory(el);
};
};
export const blurUnselectedElementCategory = function (
chartContextDom,
selectedDomInfo
) {
const chartSVGs = chartContextDom.querySelectorAll("svg");
for (let i = 0; i < chartSVGs.length; i++) {
svgVisitor(chartSVGs[i], {
visitor: function (dom) {
if (dom.tagName === "svg" || dom.tagName === "g") return;
let elTargets = dom.getAttribute("elTarget");
elTargets = {
chartTag: selectedDomInfo.chartTag,
chartType: selectedDomInfo.chartType,
chartOption: selectedDomInfo.chartOption,
svgName: dom.tagName,
...JSON.parse(elTargets),
};
if (
elTargets === selectedDomInfo ||
isTargetCategoryEqualDomCategory(elTargets, selectedDomInfo)
) {
easeOutTransitionAnimation(dom);
deleteOpacityEffect(dom);
} else {
easeOutTransitionAnimation(dom);
fillOpacityToBlurOpacity(dom);
}
},
});
}
};
export const unBlurUnselectedElementCategory = function (chartContextDom) {
const chartSVGs = chartContextDom.querySelectorAll("svg");
for (let i = 0; i < chartSVGs.length; i++) {
svgVisitor(chartSVGs[i], {
visitor: function (dom) {
deleteOpacityEffect(dom);
},
});
}
};
|
参考 & 引用
ECharts图元拾取方案 | SZ 博客 (sz-p.cn)
图表元素拾取扩大热区范围方案 | SZ 博客 (sz-p.cn)
SVG后处理 | SZ 博客 (sz-p.cn)


